
Italy - Preserved Tomatoes - Market Analysis, Forecast, Size, Trends And Insights
Get instant access to more than 2 million reports, dashboards, and datasets on the IndexBox Platform.
View PricingItaly's Export of Preserved Tomatoes Increases by 22% Reaching Record High of $1.9B in 2023
Italy Preserved Tomato Exports
In 2023, preserved tomato exports from Italy declined to 1.4M tons, waning by -7.7% compared with the year before. The total export volume increased at an average annual rate of +1.5% from 2013 to 2023; the trend pattern remained consistent, with somewhat noticeable fluctuations being observed throughout the analyzed period. The most prominent rate of growth was recorded in 2022 with an increase of 8.5% against the previous year. As a result, the exports attained the peak of 1.5M tons, and then declined in the following year.
In value terms, preserved tomato exports soared to $1.9B (IndexBox estimates) in 2023. In general, total exports indicated a strong increase from 2013 to 2023: its value increased at an average annual rate of +5.4% over the last decade. The trend pattern, however, indicated some noticeable fluctuations being recorded throughout the analyzed period. Based on 2023 figures, exports increased by +93.0% against 2016 indices. As a result, the exports reached the peak and are likely to continue growth in the immediate term.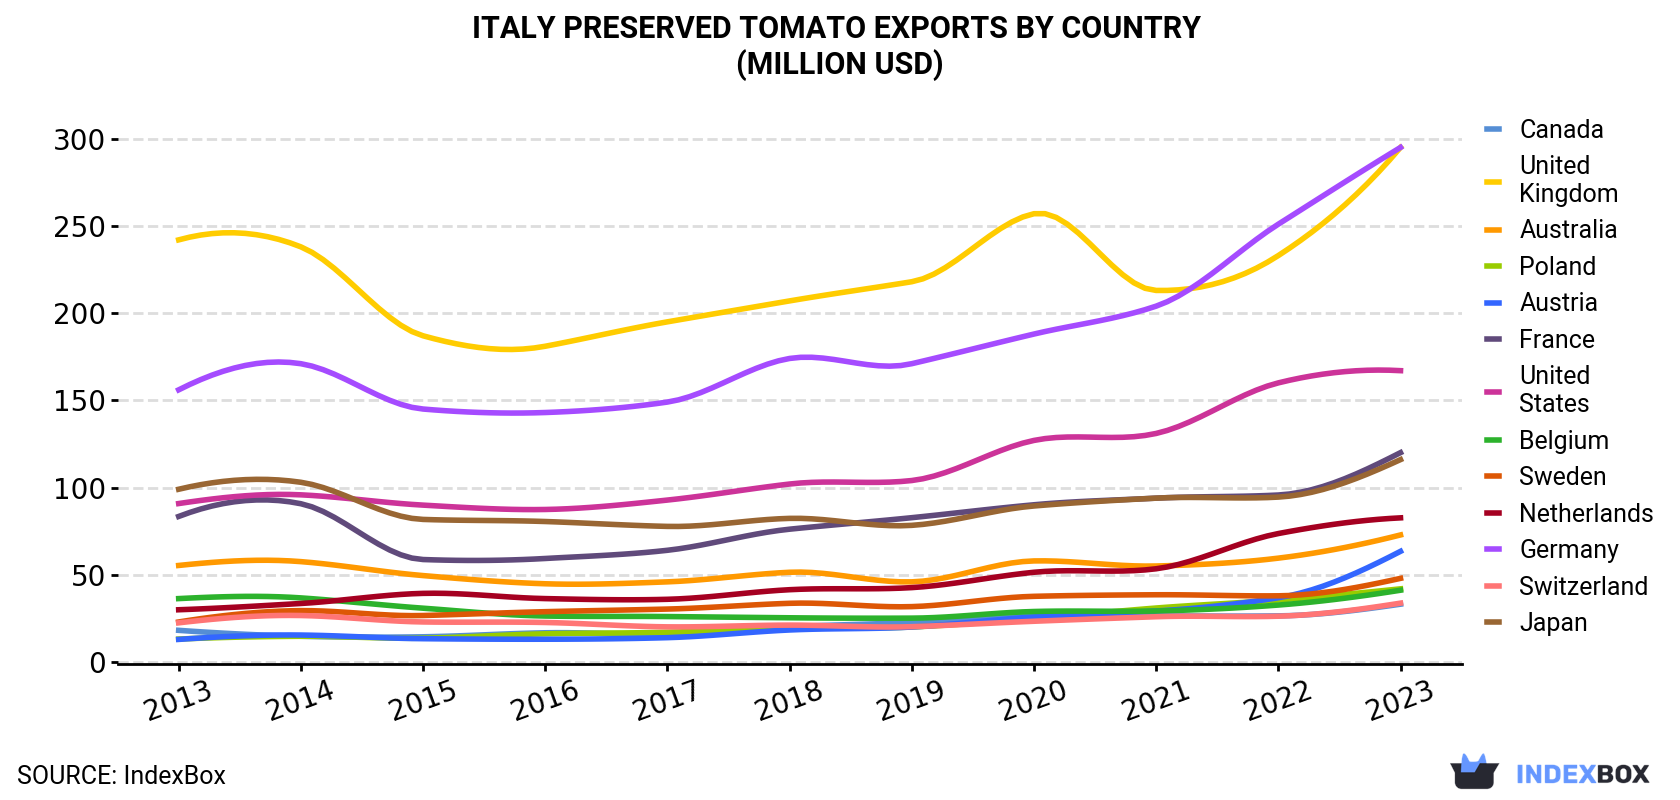
| COUNTRY | Export Value of Preserved Tomato in Italy (million USD) | ||||||||||
|---|---|---|---|---|---|---|---|---|---|---|---|
| 2013 | 2014 | 2015 | 2016 | 2017 | 2018 | 2019 | 2020 | 2021 | 2022 | 2023 | |
| United Kingdom | 242 | 238 | 187 | 181 | 195 | 207 | 218 | 257 | 213 | 233 | 295 |
| Germany | 156 | 171 | 145 | 143 | 149 | 174 | 171 | 188 | 204 | 251 | 295 |
| United States | 90.8 | 95.8 | 89.9 | 87.4 | 92.8 | 102 | 104 | 127 | 131 | 160 | 167 |
| France | 83.4 | 90.7 | 58.7 | 59.3 | 64.0 | 76.1 | 82.7 | 90.1 | 93.9 | 95.7 | 120 |
| Japan | 99.0 | 103 | 81.7 | 80.5 | 77.7 | 82.3 | 78.3 | 89.4 | 93.9 | 94.5 | 116 |
| Netherlands | 29.9 | 33.5 | 39.3 | 36.3 | 35.9 | 41.4 | 42.6 | 51.4 | 53.4 | 73.6 | 82.6 |
| Australia | 55.3 | 57.5 | 49.5 | 44.8 | 45.9 | 51.4 | 45.9 | 57.9 | 55.0 | 59.5 | 72.8 |
| Austria | 12.9 | 15.4 | 13.3 | 13.0 | 13.9 | 18.3 | 20.0 | 25.8 | 29.2 | 36.8 | 63.4 |
| Sweden | 22.9 | 29.4 | 26.6 | 28.8 | 30.3 | 33.6 | 31.7 | 37.6 | 38.5 | 37.9 | 47.9 |
| Poland | 13.1 | 14.7 | 13.6 | 16.1 | 17.0 | 20.0 | 20.0 | 24.8 | 30.9 | 35.5 | 41.9 |
| Belgium | 36.3 | 36.7 | 30.8 | 26.3 | 26.0 | 25.3 | 25.1 | 28.9 | 29.2 | 32.6 | 41.1 |
| Switzerland | 22.4 | 26.6 | 22.9 | 22.6 | 20.1 | 21.1 | 20.2 | 23.3 | 25.9 | 26.2 | 33.7 |
| Canada | 18.1 | 14.7 | 14.4 | 16.7 | 16.2 | 20.2 | 22.6 | 27.6 | 26.5 | 26.4 | 33.1 |
| Others | 220 | 243 | 213 | 210 | 230 | 248 | 256 | 254 | 302 | 364 | 452 |
| Total | 1,101 | 1,170 | 986 | 965 | 1,014 | 1,120 | 1,138 | 1,283 | 1,326 | 1,526 | 1,863 |
Exports by Country
the UK (235K tons), Germany (229K tons) and the United States (119K tons) were the main destinations of preserved tomato exports from Italy, together accounting for 42% of total exports. France, Japan, the Netherlands, Australia, Austria, Belgium, Sweden, Poland, Canada and Switzerland lagged somewhat behind, together accounting for a further 35%.
From 2013 to 2023, the most notable rate of growth in terms of shipments, amongst the main countries of destination, was attained by Austria (with a CAGR of +13.9%), while the other leaders experienced more modest paces of growth.
In value terms, Germany ($295M), the UK ($295M) and the United States ($167M) constituted the largest markets for preserved tomato exported from Italy worldwide, with a combined 41% share of total exports. France, Japan, the Netherlands, Australia, Austria, Sweden, Poland, Belgium, Switzerland and Canada lagged somewhat behind, together comprising a further 35%.
Austria, with a CAGR of +17.3%, recorded the highest rates of growth with regard to the value of exports, in terms of the main countries of destination over the period under review, while shipments for the other leaders experienced more modest paces of growth.
Export Prices by Country
In 2023, the preserved tomato price amounted to $1,338 per ton (FOB, Italy), rising by 32% against the previous year. Overall, export price indicated a noticeable expansion from 2013 to 2023: its price increased at an average annual rate of +3.9% over the last decade. The trend pattern, however, indicated some noticeable fluctuations being recorded throughout the analyzed period. Based on 2023 figures, preserved tomato export price increased by +79.7% against 2016 indices. As a result, the export price reached the peak level and is likely to continue growth in the immediate term.
Average prices varied somewhat for the major external markets. In 2023, amid the top suppliers, the highest price was recorded for prices to Sweden ($1,551 per ton) and Switzerland ($1,530 per ton), while the average price for exports to the Netherlands ($1,207 per ton) and Belgium ($1,238 per ton) were amongst the lowest.
From 2013 to 2023, the most notable rate of growth in terms of prices was recorded for supplies to Poland (+5.3%), while the prices for the other major destinations experienced more modest paces of growth.
This report provides an in-depth analysis of the preserved tomato market in Italy. Within it, you will discover the latest data on market trends and opportunities by country, consumption, production and price developments, as well as the global trade (imports and exports). The forecast exhibits the market prospects through 2030.
Product coverage:
- Prodcom 10391710 - Preserved tomatoes, whole or in pieces (excluding prepared vegetable dishes and tomatoes preserved by vinegar or acetic acid)
Country coverage:
- Italy
Data coverage:
- Market volume and value
- Per Capita consumption
- Forecast of the market dynamics in the medium term
- Trade (exports and imports) in Italy
- Export and import prices
- Market trends, drivers and restraints
- Key market players and their profiles
Reasons to buy this report:
- Take advantage of the latest data
- Find deeper insights into current market developments
- Discover vital success factors affecting the market
This report is designed for manufacturers, distributors, importers, and wholesalers, as well as for investors, consultants and advisors.
In this report, you can find information that helps you to make informed decisions on the following issues:
- How to diversify your business and benefit from new market opportunities
- How to load your idle production capacity
- How to boost your sales on overseas markets
- How to increase your profit margins
- How to make your supply chain more sustainable
- How to reduce your production and supply chain costs
- How to outsource production to other countries
- How to prepare your business for global expansion
While doing this research, we combine the accumulated expertise of our analysts and the capabilities of artificial intelligence. The AI-based platform, developed by our data scientists, constitutes the key working tool for business analysts, empowering them to discover deep insights and ideas from the marketing data.
-
1. INTRODUCTION
Making Data-Driven Decisions to Grow Your Business
- REPORT DESCRIPTION
- RESEARCH METHODOLOGY AND AI PLATFORM
- DATA-DRIVEN DECISIONS FOR YOUR BUSINESS
- GLOSSARY AND SPECIFIC TERMS
-
2. EXECUTIVE SUMMARY
A Quick Overview of Market Performance
- KEY FINDINGS
- MARKET TRENDS This Chapter is Available Only for the Professional Edition PRO
-
3. MARKET OVERVIEW
Understanding the Current State of The Market and Its Prospects
- MARKET SIZE
- MARKET STRUCTURE
- TRADE BALANCE
- PER CAPITA CONSUMPTION
- MARKET FORECAST TO 2030
-
4. MOST PROMISING PRODUCT
Finding New Products to Diversify Your Business
This Chapter is Available Only for the Professional Edition PRO- TOP PRODUCTS TO DIVERSIFY YOUR BUSINESS
- BEST-SELLING PRODUCTS
- MOST CONSUMED PRODUCT
- MOST TRADED PRODUCT
- MOST PROFITABLE PRODUCT FOR EXPORT
-
5. MOST PROMISING SUPPLYING COUNTRIES
Choosing the Best Countries to Establish Your Sustainable Supply Chain
This Chapter is Available Only for the Professional Edition PRO- TOP COUNTRIES TO SOURCE YOUR PRODUCT
- TOP PRODUCING COUNTRIES
- TOP EXPORTING COUNTRIES
- LOW-COST EXPORTING COUNTRIES
-
6. MOST PROMISING OVERSEAS MARKETS
Choosing the Best Countries to Boost Your Exports
This Chapter is Available Only for the Professional Edition PRO- TOP OVERSEAS MARKETS FOR EXPORTING YOUR PRODUCT
- TOP CONSUMING MARKETS
- UNSATURATED MARKETS
- TOP IMPORTING MARKETS
- MOST PROFITABLE MARKETS
7. PRODUCTION
The Latest Trends and Insights into The Industry
- PRODUCTION VOLUME AND VALUE
8. IMPORTS
The Largest Import Supplying Countries
- IMPORTS FROM 2012–2023
- IMPORTS BY COUNTRY
- IMPORT PRICES BY COUNTRY
9. EXPORTS
The Largest Destinations for Exports
- EXPORTS FROM 2012–2023
- EXPORTS BY COUNTRY
- EXPORT PRICES BY COUNTRY
-
10. PROFILES OF MAJOR PRODUCERS
The Largest Producers on The Market and Their Profiles
This Chapter is Available Only for the Professional Edition PRO -
LIST OF TABLES
- Key Findings In 2023
- Market Volume, In Physical Terms, 2012–2023
- Market Value, 2012–2023
- Per Capita Consumption In 2012-2023
- Imports, In Physical Terms, By Country, 2012–2023
- Imports, In Value Terms, By Country, 2012–2023
- Import Prices, By Country Of Origin, 2012–2023
- Exports, In Physical Terms, By Country, 2012–2023
- Exports, In Value Terms, By Country, 2012–2023
- Export Prices, By Country Of Destination, 2012–2023
-
LIST OF FIGURES
- Market Volume, In Physical Terms, 2012–2023
- Market Value, 2012–2023
- Market Structure – Domestic Supply vs. Imports, In Physical Terms, 2012-2023
- Market Structure – Domestic Supply vs. Imports, In Value Terms, 2012-2023
- Trade Balance, In Physical Terms, 2012-2023
- Trade Balance, In Value Terms, 2012-2023
- Per Capita Consumption, 2012-2023
- Market Volume Forecast to 2030
- Market Value Forecast to 2030
- Products: Market Size And Growth, By Type
- Products: Average Per Capita Consumption, By Type
- Products: Exports And Growth, By Type
- Products: Export Prices And Growth, By Type
- Production Volume And Growth
- Exports And Growth
- Export Prices And Growth
- Market Size And Growth
- Per Capita Consumption
- Imports And Growth
- Import Prices
- Production, In Physical Terms, 2012–2023
- Production, In Value Terms, 2012–2023
- Imports, In Physical Terms, 2012–2023
- Imports, In Value Terms, 2012–2023
- Imports, In Physical Terms, By Country, 2023
- Imports, In Physical Terms, By Country, 2012–2023
- Imports, In Value Terms, By Country, 2012–2023
- Import Prices, By Country Of Origin, 2012–2023
- Exports, In Physical Terms, 2012–2023
- Exports, In Value Terms, 2012–2023
- Exports, In Physical Terms, By Country, 2023
- Exports, In Physical Terms, By Country, 2012–2023
- Exports, In Value Terms, By Country, 2012–2023
- Export Prices, By Country Of Destination, 2012–2023


